

Benchmarking Facilities Costs to ‘Industry Norms’ – there is no ‘Quick Fix’!
Benchmarking Facilities Costs to ‘Industry Norms’ – there is no ‘Quick Fix’! by Bernard Williams FRICS
Click here if you wish to download this article as a PDF
The request for a quick ‘rule-of-thumb’ industry norm for the cost of the various fm services is common and understandable. However it is an impossible task with no valuable outcome; it is bedevilled with myriad incidences of misanalysis and enigmatic resource-driver impacts which combine to make any ‘average’ figure taken from published sources, or gathered in at second-hand by lay people, not worth the paper it is written on in terms of its use in the cost benchmarking process. Sources of error and the key resource drivers and their impact are discussed in detail and should leave no- one in any doubt as to the logic or validity of the argument being presented.
Introduction
Although the general appreciation of what Facilities is all about is growing with leaps and bounds there is a long way to go before the costs of FM services and the factors driving them are properly understood by a majority of practitioners and consultants.
A really worrying syndrome that continues to prevail is the perception that particular industries or sectors have some kind of identifiable mean cost of each service; and that then, once this has been identified, testing an organisation’s own costs against them will provide some measure of benchmarking support (or condemnation) of the cost levels currently being incurred.
Although one can quite understand why lay (as in non-FM-skilled) senior management might seek to benchmark in this simple way, professional facilities managers and/or/their advisors should know better than to allow themselves to be dragged down this non-beneficial blind alley.
To see why this popular concept is dismissed out of hand in this way let us consider what is being attempted and why a ‘quick fix’ cannot be achieved - other than at a level so high as to be worse than useless.
What are they trying to find out?
The usual business argument for comparing to the ‘industry norm’ is to see if there is any extravagance or imperfect procurement in the various facilities services - and that is highly commendable.
But we will demonstrate here that asking for it to be provided quickly and cheaply by reference to some published data or informal enquiry is something of a nonsense.
And remember that we are talking about costs now.
Of course you can and should test your service levels or qualities of specification of materials and systems against a peer group; if you can do that in a benchmarking group the discussion on who does what and why will be worth many times the resources taken up in doing so. But cost is another thing entirely as will be explained below. But first …….
The Parameters
Most FM people are well aware of the problems inherent in using common measures such as headcount and floor area to compare annual costs of similar services. We will take a quick look at some of the more common in use.
Floor area
There are nearly as many different methods of measuring floor areas as there are buildings and this is not the place to describe or define them all.
Figure ‘A’ shows the definitions of the different types of floor space and commonly accepted methods of measuring them as defined in ‘Facilities Economics’.
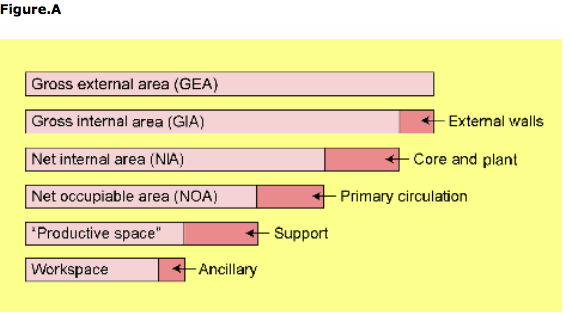
Clearly the cost of a facilities service per sq.m of the ‘Productive Space’ could be almost double that same cost set against the gross external area. A common and fatal error rife among the whole FM community is failing to specify what sort of square meters they are talking about, whether in comparing facilities costs or simply space allocation per capita.
And even when the parameter is stated clearly the areas given are often wrong for a host of reasons such as:
• lack of measurement skills
• failure to adjust building data following alterations, acquisitions, disposals etc.
• failure to adjust for sub-let or unoccupied space
• and so on
Headcount
And then we have the headcount. Differences between full-time, part-time and full-time equivalents are fairly well understood and most people recognise the need to allow for contractors in the total.
The full-time equivalent (FTE) is probably the most commonly used and for good reason. But what about visitors making extensive use of the facilities and people who hold on to workplaces while they are absent most of the time on external sites? The number of bodies in a building has a big impact on the physical environment – heat gain, waste generation, water consumption and so on – not to mention the consumption of paper, mail services and catering provisions.
You only have to divide the wrong floor area by an inappropriate headcount to get a nonsense density of occupation and that is just for starters! And we haven’t got anywhere close to the cost analysis yet. Before going on it is however only fair to point out that provided you properly identify the floor area and the headcount you have adopted you will be able to compare your density of occupation with another organisation using similar parameters. But then, what if they have a restaurant and a gym and you don’t …..
Cost comparisons
Chartered quantity surveyors measuring and analysing building costs use an industry-wide Standard Method of Measurement and standard form of Building Cost Analysis. This means that their clients have access to good benchmarking data to compare the costs of their current building proposals with the ‘industry norm’ using space as a parameter.
However, these protocols require a sound understanding of the technical nature of the services being analysed and Chartered Quantity Surveyors have 5 years training to beyond higher degree status before they are considered to be capable of using them in practice.
Even then, before their measured areas and analysed costs can be used as a building cost parameter they have to make any manner of adjustments to take account of locations, density, climate etc. – the same plethora of variable resource drivers (more about these) that impede direct comparison of the costs of facilities services.
So, even though the problems with the accuracy of the parameters are more or less avoided in construction by the use of highly trained professionals the issue of the ‘resource drivers’ in the building process has still has to be fully addressed before the overall costs per sq.m of the defined floor area can be brought to the table for benchmarking or budgeting.
Compare that highly structured process with what goes on in FM where generally speaking the areas and costs are produced by people whose skill-base is really quite inappropriate for the task.
The Facilities Resource Drivers
Figure B (also from Facilities Economics) is a real-life example of ‘before-and- after-correction’ data submitted from various sites to a standard protocol for cost analysis.
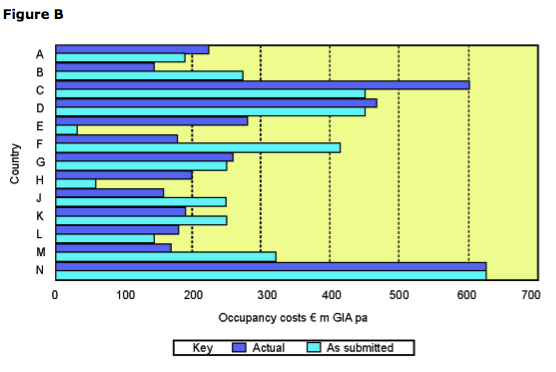
Whether you use the floor area or headcount or anything else as a parameter the resulting cost comparator will have been significantly influenced by the ‘facilities resource drivers’: these are factors which reduce or increase the resources (of labour, materials and mechanical plant) required to do the job.
The resource drivers include:
• the scope of the service
• the specification of the building
• the maintained condition of the building
• the service levels
• the density of occupation
• the size of the building
• the shape of the building
• the location
• the climate
• hours of occupancy
• accessibility
• use of cost-efficient mechanical methods (where feasible)
• service charges
• the imposition (and inclusion) of taxes
• and many more
Depending on how they fall these facilities resource drivers can move the ultimate cost up or down a min/max range by several standard deviations from the norm – possibly by up to 50% either way. So the Industry Norm for facilities is not a close run thing in the middle of a tight pack but the average of a widely distributed field.
Fail to adequately allow for some or all of these resource drivers and the resulting benchmarking will be a nonsense even assuming the comparative cost analysis is based on a similar protocol and computed correctly – unfortunately not a regular feature of facilities cost benchmarking exercises.
Costs around the norm might just be bad performers getting a lucky break from the Resource Drivers; being in the top quartile could easily be the outcome of best cost performance being delivered in the face of severely adverse Resource Drivers.
The scope
Because of the way facilities costs are accounted for in companies’ books there is rarely enough detail in the costs to know whether the scope of a cost centre is comparable with the same one in another building or in the same peer group. E.g. one organisation may include its window cleaning in maintenance and the disposal of ‘secure waste’ in security, whereas another may have them both in ‘cleaning’. The cost differential brought about by the different scope of these two cost centres could be as high as 40% even before any of the resource drivers such as window areas and diversity of occupation are taken on board. If your accounting system can identify these cost sub-centres then you can adjust the figures and start the comparison. Otherwise, forget it!
Mis-analysis can cause big differences in the scope of the service costed. E.g. if Maintenance includes a lot of whole-life replacement or project work it will totally distort any maintenance benchmarking data-group in which it turns up. OK if you know about it, but otherwise…….
Published statistics based on figures generated by lay–people in terms of measurement and protocol are highly popular with the ‘quick-fix’ brigade but usually so unreliable as to be downright dangerous in use. It is one thing to publish a protocol for measurement and analysis and entirely another to get the answers back correctly in the manner specified. The latter is unfortunately the
exception rather than the rule as demonstrated in Figure B above.
The specification
Most fm people appreciate that maintaining the mechanical and electrical services in a building with air-conditioning costs a lot more than one which is ‘heated – only’. Nevertheless, even within air-conditioning systems there is a wide range of specifications with attendant significant differences in maintenance resource requirements.
Again, some buildings may have a large amount of double glazing while others may have a large amount of reflective triple glazing: window cleaning costs and energy consumption will be markedly different in both buildings even before the geometrical Resource Drivers have impinged on the quantities. Generally speaking costs of services per sq.m of the defined floor area are lower as buildings get larger (see below) so cost comparisons of a similar service level for maintaining or cleaning a similar material/system in buildings of disparate sizes will turn out to be quite different for no apparent reason to the lay analyst.
The service levels
If you are smart enough to try to compare your own service levels with those of another organisation or a peer group still be aware that in some services the levels of input need to be raised to overcome local features such as climate, density or production methods. The chiller on the roof in Brighton will need a lot more maintenance than a similar one in a dry Basement in Eastbourne - same chiller, same region, different resource driver, very different cost.
Actually, comparison of performance levels is a very worthwhile exercise carried out in a benchmarking group with an expert facilitator who can help to unscramble the impact of the resource drivers on the required output performance. In practice input does not necessarily relate to output in either performance or cost terms so the best starting point is output delivered rather
than service level specified.
Size of the building
Size and shape have a very big impact on the quantities of materials/systems per unit of floor area and thus the extent of facilities resources deployed. E.g. on a like-for-like basis large buildings have less walls and windows per square meter of floor area than smaller ones. Consequently cost centres like window cleaning, services maintenance, energy consumption and fabric maintenance will start out with greatly variable costs per square meter of floor area (whichever parameter) before any other of the 100 or so other Resource Drivers have even begun to impact.
Even some publicly available statistics on ‘good practice’ energy management completely ignore the effects of shape and size on energy consumption – a serious and remiss lack of understanding of facilities economics.
The location and climate
Apart from obvious climatic resource drivers like degree-days and rainfall the access to the site by a well-trained reasonably paid workforce can have a big influence on costs: business security requirements likewise.
Hours of occupancy
Some buildings have a 24/7 occupancy and although not all of the facilities services costs increase in proportion – some of them do. Often the working hours are at the whim of management and may relate to many factors which are site- specific rather than a normal feature of the particular industry.
Accessibility
Some parts of a building are much easier to access than others both in physical terms and in terms of times of operation. The availability of standby pumps etc. can make it a lot easier to close parts of a service down for maintenance. However, it is not uncommon for such beneficial design features to be ‘value- engineered’ out of a scheme at design stage!
Use of cost-efficient mechanical equipment
In some buildings large areas can be cleaned using ride-on cleaners whereas smaller buildings having a similar function may not permit this facility. We are talking about big differences here, especially in industrial buildings where the workers often clean their own workplaces and only the aisles are in the cleaning operation. Just to labour the point the cost per sq.m GIA of cleaning an industrial building with narrow aisles where the operation includes the workplaces can be 4- 5 times greater than the converse. What norm?
Service Charges
In tenanted buildings some costs may be borne by the landlord but there is no golden rule about what or why. Benchmarking Service Charges themselves is extremely complicated and definitely not one for the DIY- data-collection–and- analysis brigade
Taxes
Forget to state whether or not your costs (or theirs) include VAT at your peril: 15% difference will be there before you start any benchmarking comparison!
Conclusion
Maybe the point here is a bit over-laboured but then most people in FM don’t realise how difficult it really is to compare costs and space use at a high level – which is essentially what the Industry-norm scenario is all about.
Apart from the fact that it is a pretty meaningless benchmark anyway - even if you could find it - how could you know that everyone operating at that level had worked the business case from first principles setting cost of service delivery against the cost of lost output avoided or incurred? In a recent benchmarking study 2 organisations with a completely similar personnel profile and operational functional requirements had costs per sq.m GIA or FTE which differed by a factor of 3 – and neither of them was at or near the average for the industry. Actually one was overproviding to a totally unnecessary extent while the other was risking a staff revolt! The latter knew they must have it at the wrong level but still needed the misplaced comfort of being told they were actually in the lower quartile. On the other hand the former were at the average for the industry and such comfort would have been totally counter-productive.
So, the next time someone asks you to go away and come back with the industry norm for facilities just show them this article, ask them to study it carefully and then ask if they still want you to waste your time trying to do it. If they do, then they are probably the industry norm themselves right now!
Bernard Williams is Managing Director of International Facilities and Property Information Ltd. and a consultant to Bernard Williams Associates (BWA). He is a visiting Professor in the Facilities
Management and Development Group at Sheffield Hallam University.
